Carbon Cut

Full-stack web application for carbon emission tracking and sustainability analytics


Full-stack web application for carbon emission tracking and sustainability analytics

A full-stack web application built with React, Node.js, and PostgreSQL to help businesses track and reduce their carbon footprint through real-time data visualization and comprehensive analytics. Features include API integrations with third-party data sources, multi-tenant architecture, and interactive dashboards powered by D3.js.
Carbon Cut was developed for a manufacturing company that needed comprehensive visibility into their carbon emissions across multiple facilities. They required a custom web application to track over 50,000 tons of CO2 annually, identify emission sources, and generate actionable insights for reduction strategies.
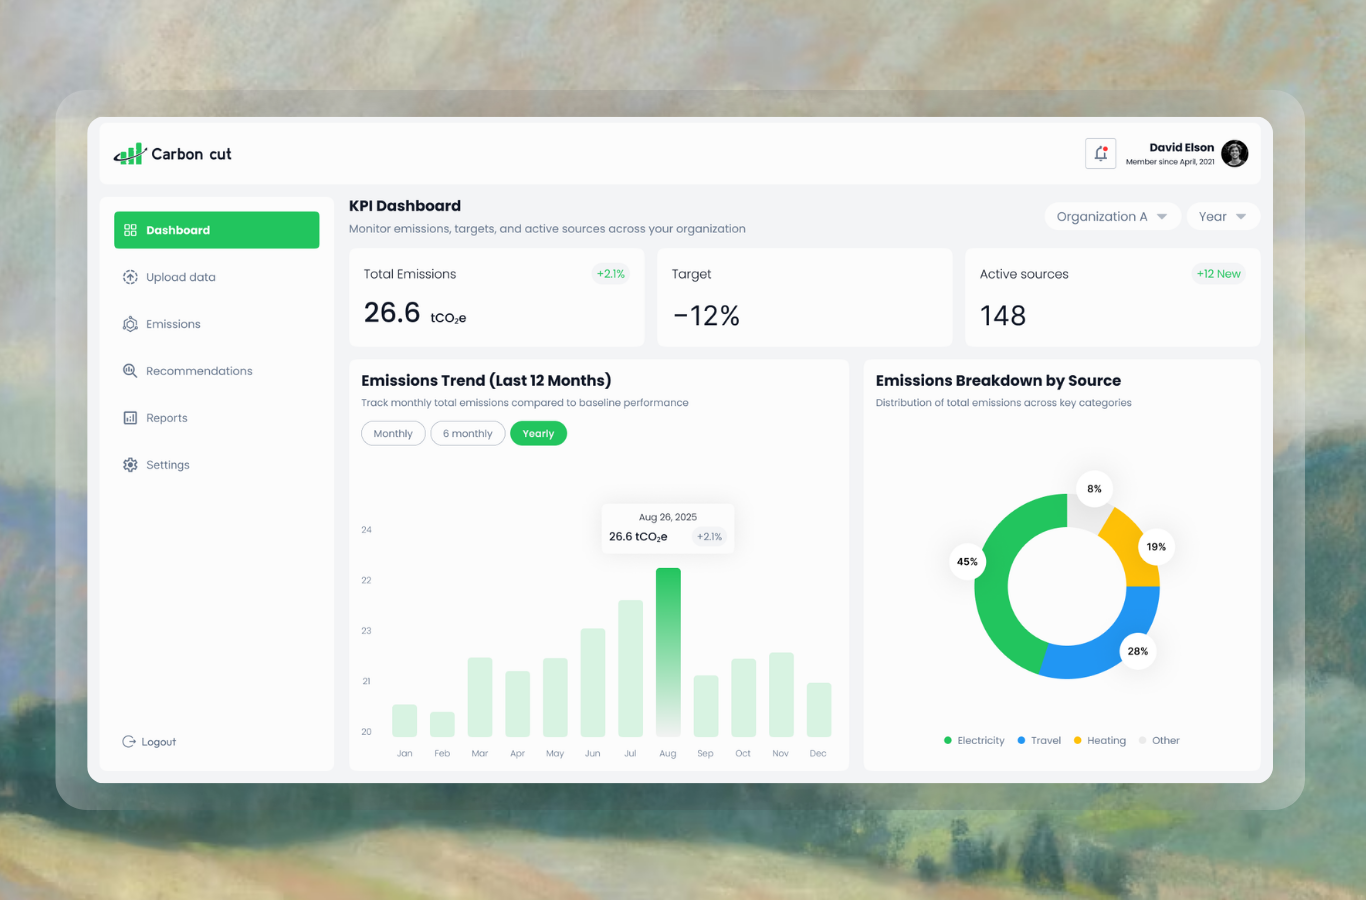
The challenge was to build a real-time dashboard that could process complex environmental data from multiple sources, visualize trends, and provide automated reporting. We designed a scalable architecture that supports multi-tenant deployment, allowing the platform to serve multiple business units while maintaining data isolation and security.
We built Carbon Cut using modern web technologies optimized for data processing and visualization:
React: Component-based UI architecture for responsive dashboards
D3.js: Custom data visualizations for emission trends and analytics
TypeScript: Type-safe development for reduced bugs and better maintainability
Tailwind CSS: Responsive design system for consistent UI
Node.js/Express: RESTful API for data processing and business logic
PostgreSQL: Relational database for structured emission data and reporting
Redis: Caching layer for real-time dashboard performance
AWS: Cloud deployment with EC2, RDS, and S3 for scalability
Real-time Tracking: Live emission data updates with WebSocket connections
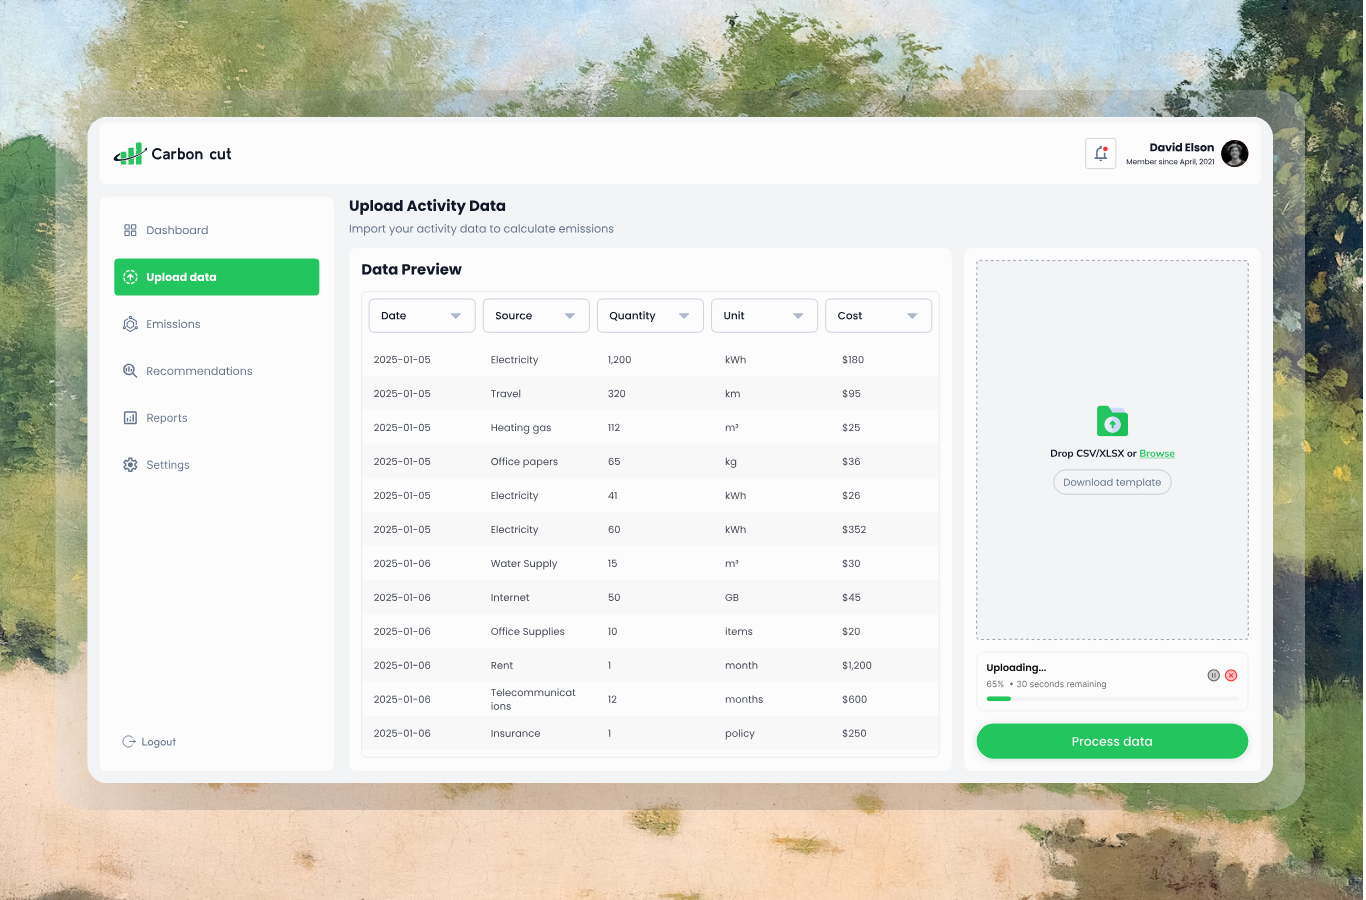
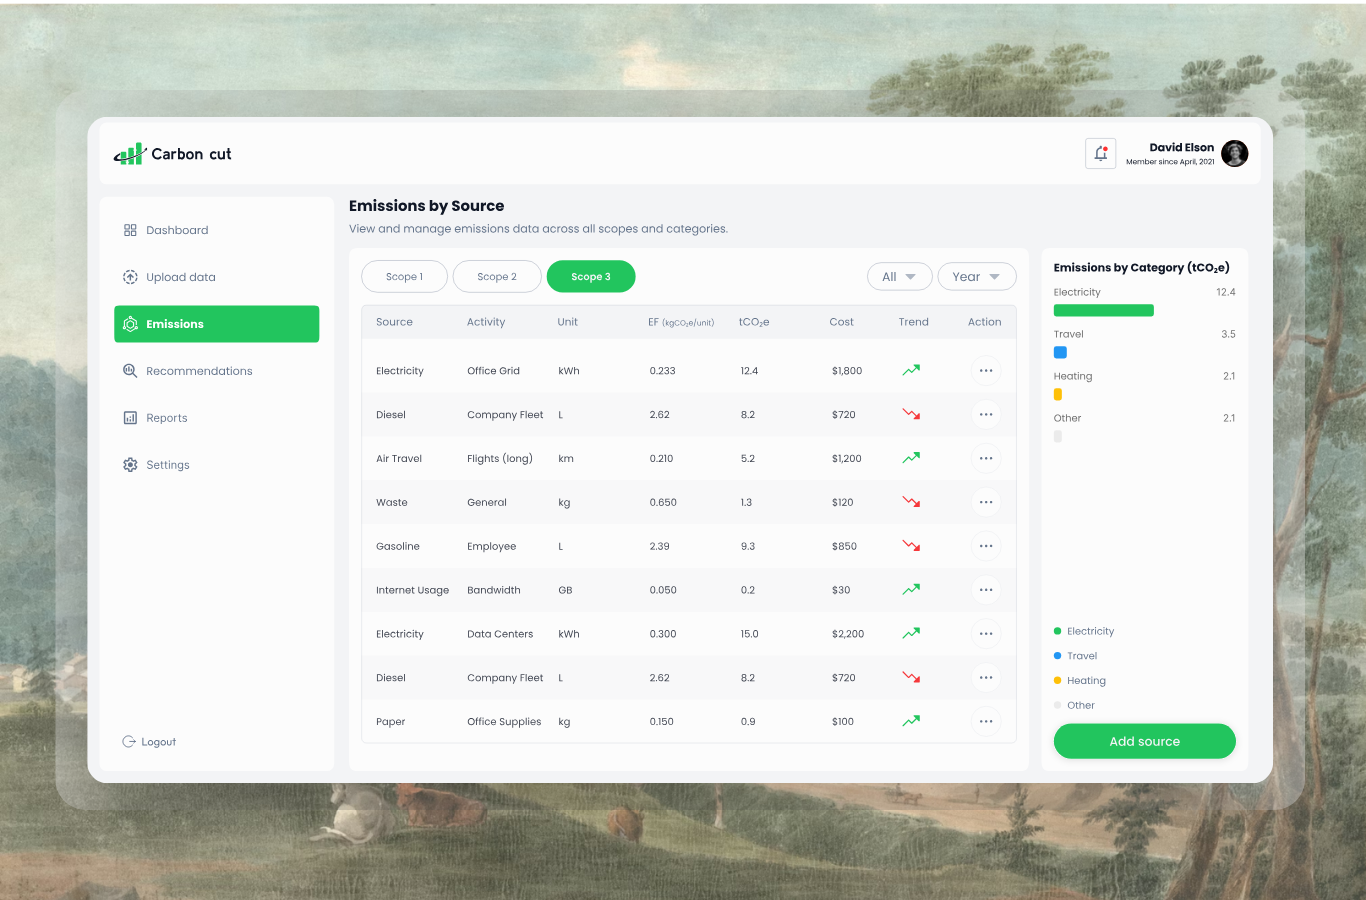
API Integrations: Third-party data sources for utility consumption and carbon factors
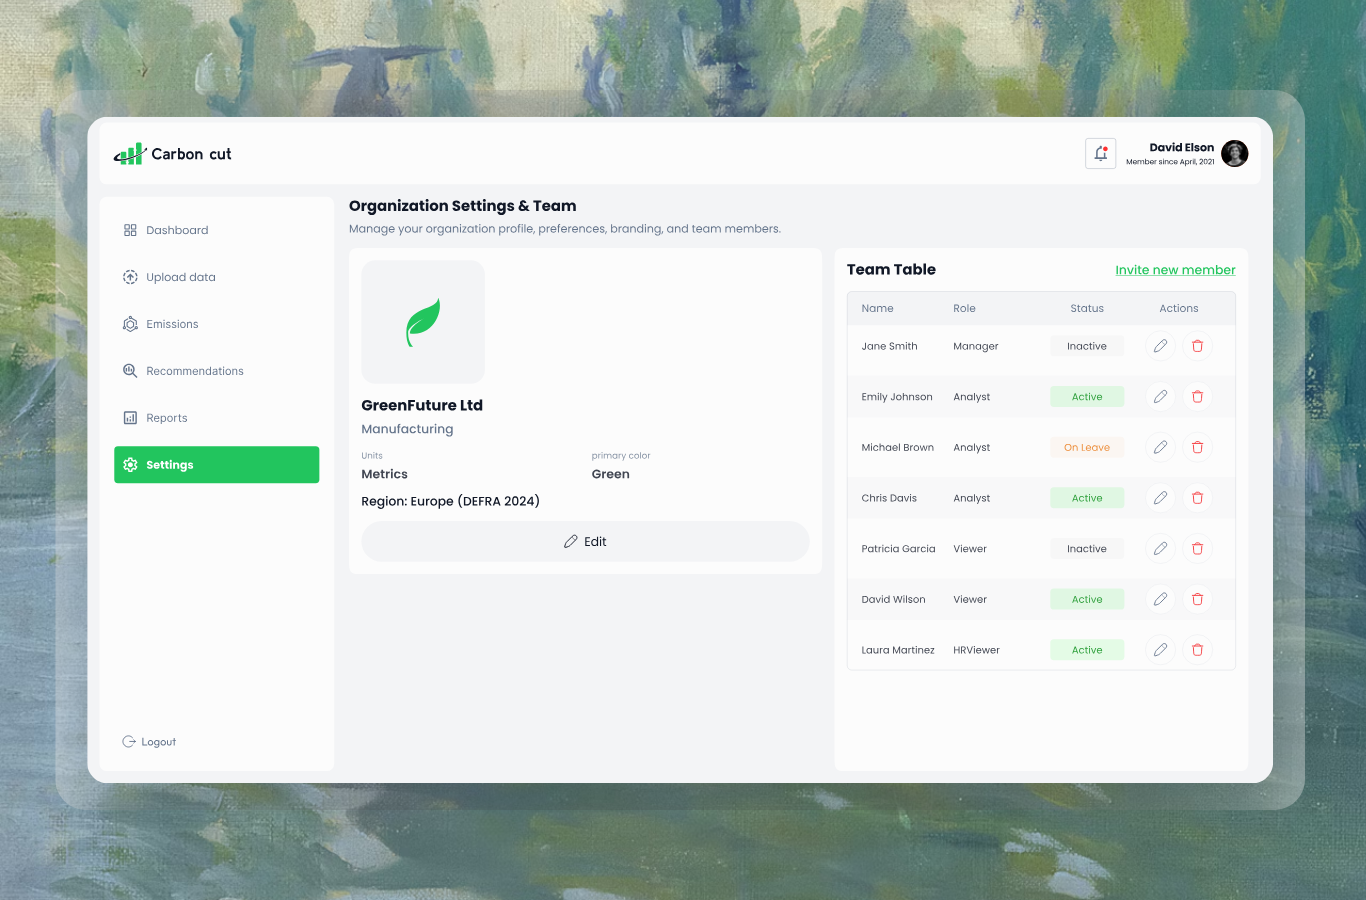
Multi-tenant Architecture: Isolated data storage for different business units
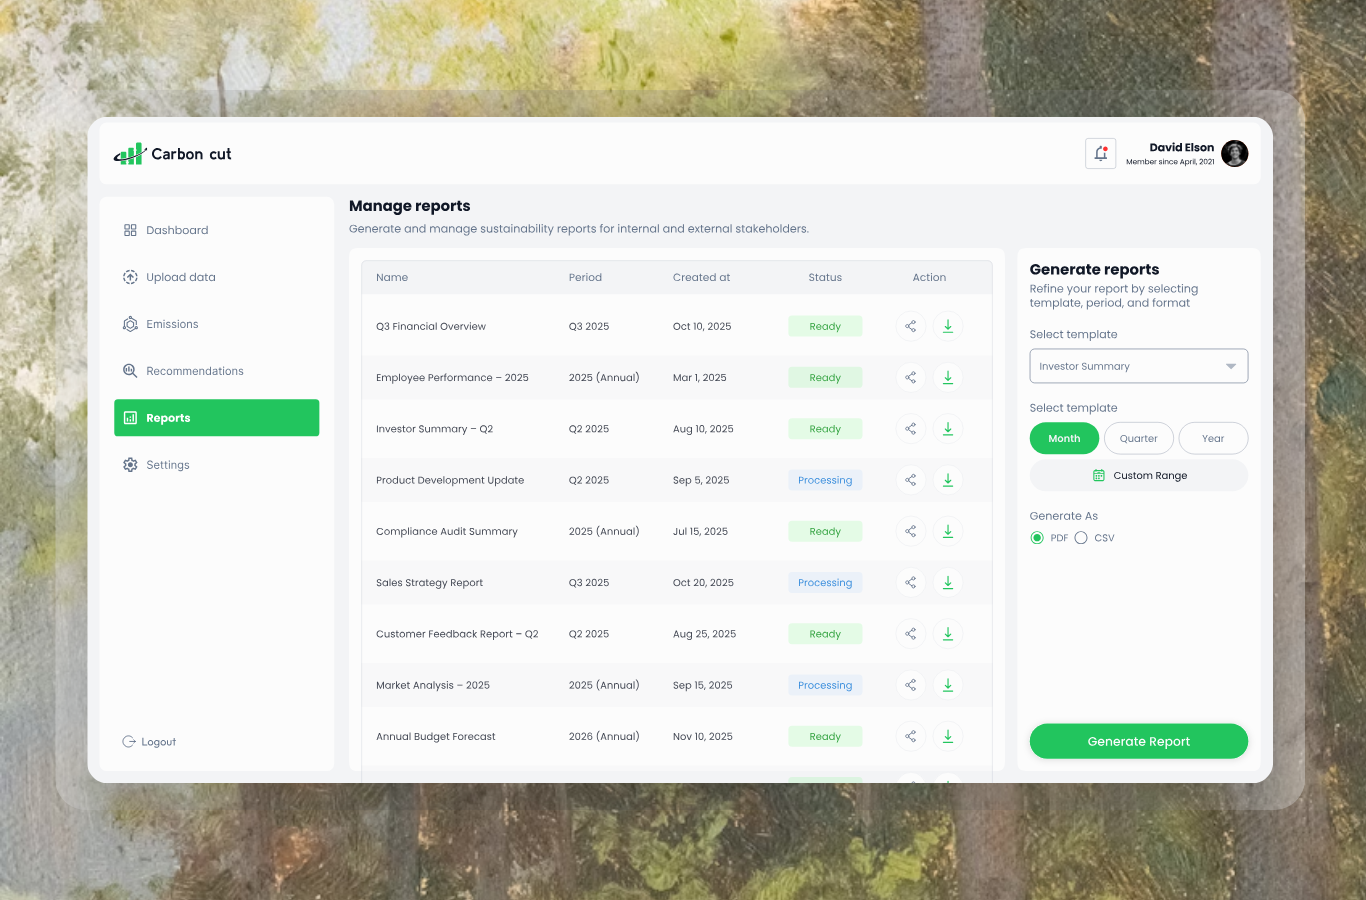
CSV Export: Automated reporting and data export capabilities
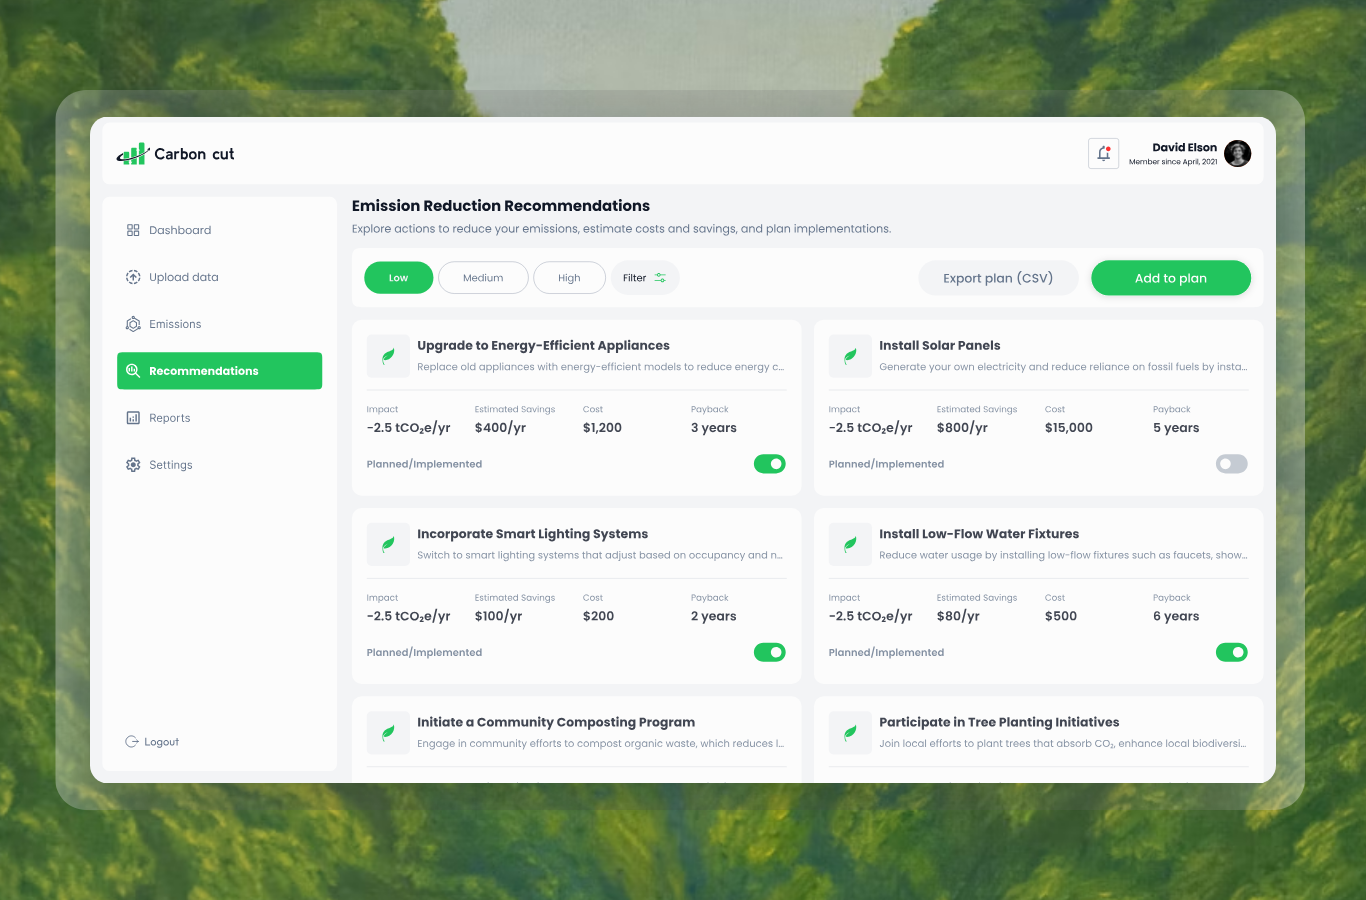
The design phase focused on creating an intuitive dashboard that transforms complex environmental data into clear, actionable insights. We developed interactive Figma prototypes featuring real-time charts, customizable widgets, and streamlined data entry workflows. The mobile-responsive design ensures accessibility across devices for field teams and executives alike.
We followed an 8-week agile development timeline, implementing features in sprints and conducting regular testing with sustainability teams. The platform was built with scalability in mind, supporting both single-tenant and multi-tenant deployments through configuration-based architecture.
Page Load Time: Under 1.5 seconds for dashboard with 10,000+ data points
Data Processing: Real-time calculations handling 500+ emission sources
API Response Time: Average 200ms for complex queries
Uptime: 99.8% availability since launch
Mobile Performance: Fully responsive with progressive web app capabilities
Carbon Cut demonstrates our expertise in building data-intensive web applications that combine powerful backend processing with intuitive user interfaces. The platform continues to help organizations track and reduce their carbon footprint through technology-driven insights.